Skip to content
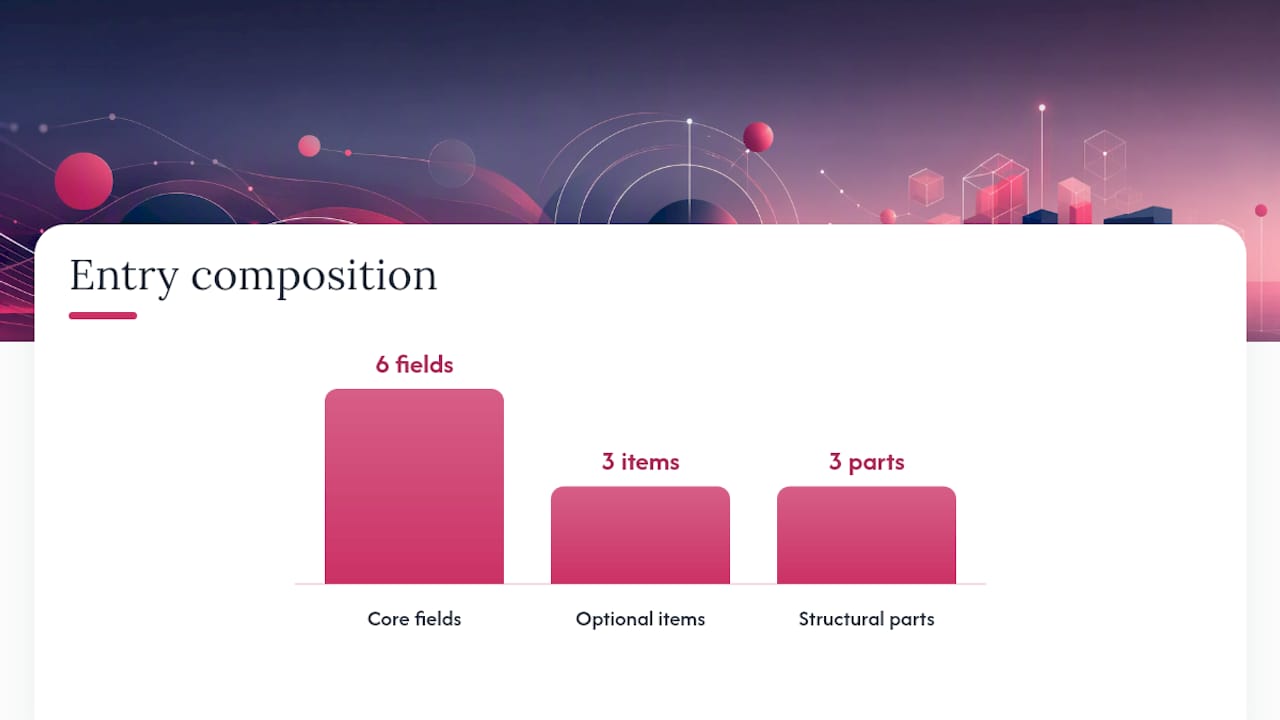
Start logging six fields for every trade today: date and time, instrument, direction, entry and exit price, position size or risk percentage, and net P&L. Add one sentence describing what happened and what you’d repeat or avoid. That’s it. Logging takes under a minute per trade, and a focused 20 to 30 minute weekly review turns those scattered entries into a system you can actually improve.
TL;DR:
- Logging errors often stem from manual re-typing of fills, especially with partial executions, which Cubo Markets’ platform helps prevent with automatic trade imports.
- Weekly reviews focusing on win rate, risk-to-reward, and rule adherence outperform monthly analysis in improving trading skills efficiently.
- Essential journal fields include instrument, entry and exit prices, P&L, and a one-sentence lesson, with extra context added only after establishing the core habit.
- High-frequency, complex, or multi-instrument traders benefit from automated tools, which reduce friction and maintain data accuracy for reliable metric tracking.
- Maintaining a lean journal with just six core fields and consistent weekly reviews ensures sustained discipline and continuous performance improvement.
Table of Contents
- What Is a Trading Journal, and What Are Its Two Layers?
- Why Does Every Trader Need a Trading Journal?
- What Should Every Journal Entry Include?
- When Should You Journal, and How Often Should You Review?
- Which Metrics Actually Prove You’re Improving?
- Should You Use a Spreadsheet, a Notebook, or an App?
- What Do Real Journal Entries Look Like?
- How Do You Build a Journaling Habit That Actually Sticks?
- How Does Cubo Markets Reduce Journaling Friction?
- How Should Day Traders, Swing Traders, and Long-Term Investors Adjust Their Journals?
- Our Take: Keep the Journal Lean Enough to Actually Use
- Sources
What Is a Trading Journal, and What Are Its Two Layers?
A trading journal is a record of every trade you take, built to reveal patterns your memory will never catch on its own. It works because it has two layers that do different jobs.
The data layer is the objective log: prices, size, timestamps, and outcome. Numbers only, no interpretation. The narrative layer is where you write what you were thinking, what triggered the trade, and what you learned. Pairing a hard fact with a short lesson is what actually changes behavior. A three-layer entry structure that separates data from context from lesson is what turns a spreadsheet into a real coaching tool rather than a receipt drawer.
The minimum fields that feed every metric later:
- Date, time, and instrument traded
- Direction (long or short) and position size
- Entry price, exit price, and stop-loss level
- Net P&L in dollars and as a percentage of account
- Setup type or strategy tag
- One sentence: the lesson
Skip any of these and your weekly review will have gaps you can’t fill retroactively.
Why Does Every Trader Need a Trading Journal?
Because raw P&L lies to you. A profitable week can hide five rule violations that got bailed out by luck, and a losing week can hide four perfectly executed trades that simply didn’t work out. Only a journal separates process from outcome.
Journaling exposes insights that your account balance alone cannot reveal, such as which setups are genuinely profitable versus favored, the reasons behind losses whether from poor entries or abandoning plans early, emotional patterns including oversizing after wins or revenge trading, and discrepancies between stated risk tolerance and actual behavior under pressure.
Weekly review compounds faster than daily P&L-watching because a single week gives you enough trades to spot a pattern without the noise of any one outcome. A weekly review focused on win rate, risk-to-reward, and rule compliance produces the largest single improvement in a trader’s process, more than tweaking indicators or hunting for a better entry signal ever will.
What Should Every Journal Entry Include?
Prioritize fields by how much diagnostic value they add per second of effort. Here’s the order to build your entry in:
- Instrument, direction, and timestamp. Capture this the moment you place the order, not after you see how it turns out.
- Entry price, stop-loss, and position size (or risk %). This tells you whether the trade matched your risk plan before you know the result.
- Setup tag. A short label like “breakout” or “pullback” so you can filter later.
- Exit price and net P&L. Log immediately after the position closes.
- Rule compliance. A simple yes or no: did you follow your plan?
- The one-sentence lesson. What you’d repeat or avoid next time.
- Optional: screenshot, market context, or emotional state. Add these once the first six are automatic.
Structure each entry in three parts. First, the pre-trade plan: why you’re entering, where your stop and target sit, and what invalidates the idea. Second, notes during the trade if anything material changes, like a news catalyst or a moved stop. Third, the post-trade review: what actually happened against what you planned.
Keep the whole thing under 60 seconds per trade. The moment logging starts feeling like homework, you’ll skip it on your busiest, most instructive days, which are exactly the days you need the data most. Starting with a short core set of fields rather than an exhaustive form is what keeps people journaling past week two.
When Should You Journal, and How Often Should You Review?
Timing matters more than most guides admit. Log the setup and your reasoning right after you place your stop-loss and take-profit, before you know how the trade will resolve. Waiting until after the outcome lets hindsight rewrite your own reasoning, and you’ll unconsciously describe the plan as smarter (or dumber) than it actually was.
Here’s the cadence that works:
- Pre-trade: Write the setup, entry logic, stop, and target before you click buy or sell.
- Post-trade, immediately: Log exit price, P&L, rule compliance, and the one-sentence lesson within minutes of the trade closing.
- Weekly review (20 to 30 minutes): Calculate win rate and average risk-to-reward for the week, pull your three best and three worst trades, and tally rule compliance as a percentage.
- Monthly deep dive: Look for a single recurring behavioral pattern, like sizing up after two consecutive wins, and set one specific rule to fix it.
A weekly ritual built around win rate, R:R, and a short list of best and worst trades produces faster skill gains than a long, unfocused monthly review that tries to cover everything at once.
Pro Tip: Attach your weekly review to something you already do, like Sunday coffee or Friday market close. A journaling habit that isn’t tied to an existing ritual gets skipped the first busy week and never comes back.
Which Metrics Actually Prove You’re Improving?
Most traders track P&L and call it a day. That number tells you almost nothing about whether your system works, because a few outlier trades can flatter or ruin a month. These five metrics tell you more:
- Win rate: Winning trades divided by total trades. Useful only alongside risk-to-reward, since a 40% win rate with a 3:1 reward ratio beats a 70% win rate with a 1:3 ratio.
- Average risk-to-reward (R:R): Average gain on winners divided by average loss on losers.
- Expectancy: (Win rate × average win) minus (loss rate × average loss). Expectancy above zero is the baseline requirement for any system to survive long term.
- Profit factor: Gross profit divided by gross loss. Above 1.5 generally signals a durable edge.
- Trade quality score: Planned trades divided by total trades, times 100. A score climbing toward 90% or higher, even with flat P&L, means your discipline is improving before the results catch up.
Track trade quality score alongside expectancy to monitor process improvements ahead of profit and loss outcomes.
Should You Use a Spreadsheet, a Notebook, or an App?
The right format depends entirely on how often you trade and how complex your instruments are, not on which tool has the flashiest dashboard.
A spreadsheet works fine if you place a handful of trades a week in stocks or forex with single fills. You control every column, it’s free, and manual entry forces you to actually think about each trade rather than skimming an auto-generated row. A notebook works too, especially for the narrative layer, though you’ll eventually want the data layer somewhere searchable.
Automation becomes beneficial when trading frequently, using multiple instruments, or managing complex entries like partial fills and funding payments on crypto perpetuals. Reconciling average entry price across several fills by hand invites errors that quietly corrupt your expectancy calculation. Auto-imported trade history removes the single biggest reason active traders abandon their journal: the friction of manual entry after a busy session.
Before picking a tool, check that it handles:
- Automatic trade import from your broker
- Custom tags for setups and strategies
- Screenshot or chart attachment per entry
- P&L reconciliation across partial fills
- Fast filtering by tag, date, or instrument
If you’re moving from spreadsheet to automated, log your first 200 trades manually to confirm which fields actually matter to you before switching, so you don’t lose historical comparability.
What Do Real Journal Entries Look Like?
Concrete examples beat abstract advice. Here are four entries showing how the same six fields produce four very different lessons.
- Clean winner. Long EUR/USD, entered on a confirmed breakout, stop and target set before entry, exited at target for a 2.1R gain. Lesson: “Waited for the retest before entering, patience paid directly.”
- Correct loss. Short gold, valid setup, stopped out for a 1R loss when the level failed. Lesson: “Followed the plan exactly, this is the cost of doing business, not a mistake to fix.”
- Revenge trade. Doubled position size on the next trade after the loss above, no clear setup, stopped out for a 2.4R loss. Lesson: “Sized up out of frustration, not analysis, this is the pattern to catch earlier.”
- Bad setup that won. Entered without a clear invalidation point, market drifted in favor anyway, closed for a small profit. Lesson: “Got paid on a trade I shouldn’t have taken, don’t mistake this for a good process.”
Tag each entry so you can filter for “revenge trades” or “no clear stop” later and see exactly how much they’ve cost you. The lesson line is the one field worth protecting above all others. It’s the single element most likely to change your next hundred trades.
How Do You Build a Journaling Habit That Actually Sticks?
Most journals die in the first two weeks because they start too complicated. The fix is almost embarrassingly simple: start with 7 to 8 non-negotiable fields, nothing more, and add context fields like emotional state or market regime only after the basic habit holds for a month.
Set a timer if you have to. Sixty seconds per trade, no exceptions, no rewriting your reasoning after you know the outcome. Attach the habit to something you already do every trading day, like closing out your platform or grabbing coffee, so it rides on existing behavior instead of competing for willpower.
Put your weekly review on a recurring calendar block, not a “whenever I have time” intention. That’s the step most people skip, and it’s the one that actually produces improvement. Pick exactly one insight per month to test as a rule change, rather than trying to fix five habits simultaneously.
Pro Tip: If a field feels like a chore to fill in, cut it. A journal with seven fields you fill in every single day beats one with twenty fields you abandon by Thursday.
How Does Cubo Markets Reduce Journaling Friction?
The biggest threat to any journal isn’t laziness. It’s data entry errors that come from manually re-typing fills, especially across multiple partial executions.
Cubo Markets addresses this at the platform level. Fast order execution with spreads starting at 0.0 pips and zero commission means fewer slippage-related discrepancies between what you planned and what actually filled, so your entries stay accurate without extra reconciliation work. Real-time analytics inside the platform let you cross-check your manual notes against actual execution data instead of relying on memory.
A few specifics worth knowing:
- Exportable trade history lets you pull fills directly into a spreadsheet or journaling tool instead of retyping prices by hand.
- Demo accounts give beginners a space to build the journaling habit before risking capital, which matters since the habit is hardest to form in your first weeks.
- MetaTrader 5 and WebTrader support means your execution data is structured consistently, which keeps expectancy and profit factor calculations clean across months of entries.
- Over 3 million executed orders processed on the platform reflects the kind of execution reliability that keeps your logged fill prices matching what actually happened in the market.
Reliable execution data is the foundation every metric in this guide depends on. Garbage fills produce garbage expectancy numbers no matter how disciplined your logging is.
How Should Day Traders, Swing Traders, and Long-Term Investors Adjust Their Journals?
The six core fields stay identical across every style. What changes is cadence, context, and which metrics matter most.
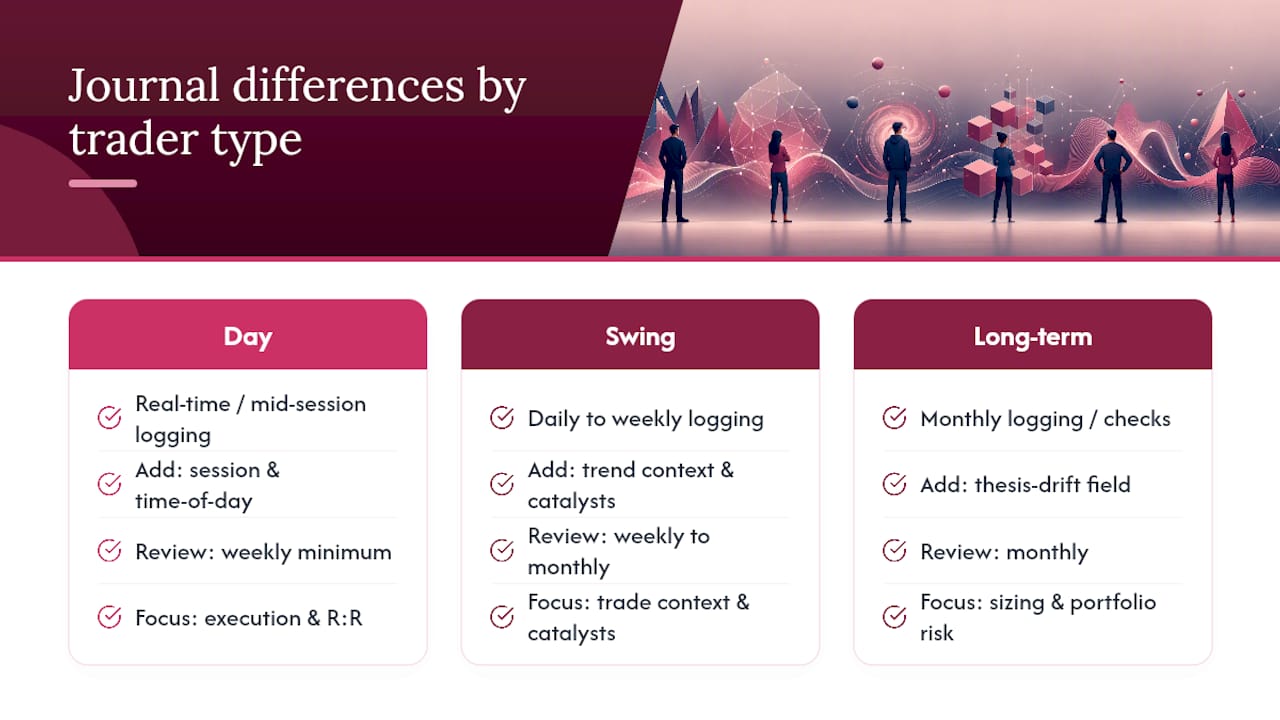
Day traders need entries logged in real time, often mid-session, since dozens of trades a day make end-of-day recall unreliable. Add a field for time-of-day and session (London open, New York overlap) since intraday edge often clusters around specific windows. Review weekly at minimum, since volume gives you a statistically meaningful sample fast.
Swing traders holding positions for days to weeks should add a field for the broader trend context and any scheduled catalysts (earnings, central bank decisions) that might affect the position while it’s open. Weekly review still works, but monthly review carries more weight since fewer trades close each week.
Long-term investors holding for months should track thesis drift, meaning whether the original reason for the position still holds, as its own field, checked monthly rather than daily. Position sizing and portfolio-level risk matter more here than any single trade’s R:R, since one holding rarely dominates outcomes the way it does in day trading.
Across all three, the lesson field never disappears. It just gets reviewed on a longer clock.
Our Take: Keep the Journal Lean Enough to Actually Use
The evidence points in one direction: complexity kills journaling before bad habits ever get the chance to. Every source on this topic agrees that traders abandon detailed journals within weeks, while the ones who stick with a lean, seven-field version for months are the ones who actually improve.
Conventional advice oversells the narrative layer too early. Emotional state, market regime, screenshots: all useful, none of it matters if you never build the base habit first. Add context fields after the data layer is automatic, not before.
Prioritize the weekly review over daily P&L-checking. Checking your account balance every hour teaches you nothing about your process; a focused 20 minute weekly session teaches you almost everything. If you take one thing from this guide, take that: six fields, one lesson sentence, one weekly review. Everything else is optional until that habit holds.
Ready to put a cleaner execution record behind your journal? Open a Cubo Markets trading account and start logging trades against fills you can actually trust.
— Cubo
This article is general information, not a substitute for advice from a qualified financial advisor. Consult a qualified financial professional about your own circumstances before acting on anything here.
Sources
- How to Keep a Trading Journal: The Complete Guide for 2026 | Treydly
- How to Build a Trading Journal That Works (2026) | Traders Second Brain
- Tradejournal
- Trading Journal: The 5-Step Method + Free Template — Captain Trading