Skip to content
The risk reward ratio measures how much you stand to gain for every dollar you put at risk on a trade, calculated as Risk : Reward, where Risk equals your entry price minus your stop-loss and Reward equals your target minus your entry. Most experienced traders look for a minimum of 1:2, meaning a $200 potential loss should chase at least $400 in potential profit.
That ratio alone won’t tell you if a strategy makes money. Risk reward ratio has to be read next to your actual win rate before it means anything.
- Risk = Entry price − Stop-loss price
- Reward = Target price − Entry price
- Ratio = Risk ÷ Reward, expressed as 1:X
Baseline to remember: a 1:2 ratio typically requires about one-third of trades to be winners to break even, which is why so many trading plans anchor to it.
TL;DR:
- A 1:2 risk reward ratio requires roughly one-third win rate to break even, making it a common baseline for many traders, especially in funded accounts.
- The actual profitability depends on pairing the ratio with expectancy, which accounts for win rate, average win, and average loss, not ratio alone.
- To maintain an effective ratio, traders must set fixed stop-loss and target levels before entering a trade, based on market structure or ATR analysis.
- Position sizing should limit risk to 1-2% of the account per trade, calculated from your stop distance and risk percentage, to withstand drawdowns.
- Costs such as spreads, commissions, and slippage tend to erode the realized risk reward ratio, so traders must factor these into their planning and review actual outcomes regularly.
Table of Contents
- What the Risk Reward Ratio Actually Measures
- How to Calculate Risk Reward Ratio Step by Step
- Breakeven Win Rate and Expectancy: The Math That Actually Decides Profitability
- Position Sizing: Turning Your Ratio Into a Real Trade
- Realistic Risk Reward Targets by Trading Style
- Why Your Real Risk Reward Ratio Rarely Matches Your Plan
- Applying Risk Reward Ratio on the Cubomarkets Platform
- Key Takeaways
- What Actually Matters When You Use This Ratio
- Sources
What the Risk Reward Ratio Actually Measures
Every trade has two boundaries you set before you click “buy” or “sell”: the price where you admit you’re wrong (your stop) and the price where you take your win (your target). The distance from entry to stop is your risk. The distance from entry to target is your reward. The ratio between them is nothing more than a snapshot of that math, but it changes how you should think about every trade you take.
Notation matters more than people assume. Write it consistently as risk-to-reward (1:2 means risking one unit to make two) or you’ll eventually confuse yourself mid-analysis when comparing setups. Some traders flip the convention and write “R” as a multiple of risk, so a 1:2 trade becomes “2R.” Pick one system and stick with it across your trading journal, because switching formats is how good traders miscalculate position size on a Tuesday afternoon.
Here’s the part that trips up newer traders: a favorable ratio lowers the bar for how often you need to be right. At 1:1, you need to win more than half your trades just to turn a profit after costs. At 1:3, you can be wrong two out of every three times and still come out ahead. That’s the entire appeal of risk reward ratio as a concept. It’s not about predicting the market correctly more often. It’s about structuring trades so that being wrong costs you less than being right pays you.
- Risk is defined by your stop-loss placement, not your gut feeling about “how much you can afford to lose”
- Reward is defined by a realistic target, not wishful thinking about where a chart “should” go
- The ratio only holds meaning when both numbers are set before the trade, not adjusted afterward
How to Calculate Risk Reward Ratio Step by Step
You need exactly three numbers before you can calculate anything: your entry price, your stop-loss, and your take-profit. Skip any one of them and you’re not trading with a plan, you’re guessing with extra steps.
- Identify your entry price — the price at which you actually get filled, not the price you wished for.
- Set your stop-loss — based on market structure, a support/resistance level, or an ATR (Average True Range) multiple, never on how much you feel like risking.
- Set your take-profit — based on the next realistic resistance, a measured move, or a fixed multiple of your risk.
- Subtract to find risk and reward, then divide reward by risk to simplify into 1:X.
Here’s how that plays out across three asset classes:
The forex example is worth slowing down on, because pip math confuses people who are otherwise fine with dollar math. On a standard lot of EUR/USD, one pip is worth roughly $10, so a 50-pip stop equals $500 of risk. A 100-pip target equals $1,000 of reward. Divide $1,000 by $500 and you get a clean 1:2, same ratio as the stock example, just expressed in a different unit.
Round to one decimal place when the ratio doesn’t land on a whole number, and keep your units consistent. Don’t calculate risk in pips and reward in percentage terms in the same worksheet. That inconsistency is how traders convince themselves a mediocre setup looks better than it is.
Breakeven Win Rate and Expectancy: The Math That Actually Decides Profitability
A risk reward ratio only tells half the story until you pair it with the breakeven win rate, the minimum percentage of trades you need to win just to avoid losing money. The formula is straightforward: Breakeven win rate = Risk / (Risk + Reward).
Notice the pattern: as your reward multiple climbs, the win rate required to survive drops fast.
Breakeven win rate only proves you won’t lose money over time. It says nothing about how much you’ll actually make. That’s where expectancy comes in. Investopedia defines expectancy as Expectancy = (Win rate × Average win) − (Loss rate × Average loss).
Run a real example.
- Win rate: 40%, average win: $200
- Loss rate: 60%, average loss: $100
- Expectancy = (0.40 × $200) − (0.60 × $100) = $80 − $60 = $20 per trade
That $20 positive expectancy is the actual number that matters, not the 1:2 ratio by itself. A strategy with a worse ratio but a much higher win rate can post a better expectancy, and vice versa. Traders who obsess over win rate alone while ignoring this calculation routinely misjudge whether their own system has an edge.
Position Sizing: Turning Your Ratio Into a Real Trade
Risk reward ratio tells you the shape of a trade. Position sizing tells you how much of that shape you can afford to take. Skip this step and even a mathematically sound 1:2 setup can blow up an account if you size it wrong.
On a $10,000 account, that’s $100 to $200 at stake, no matter how confident you feel about the setup.
- Decide your risk percentage. Most risk management frameworks recommend 1%, occasionally up to 2% for higher-conviction setups.
- Calculate dollar risk. On a $10,000 account at 1%, that’s $100.
- Determine your stop-loss distance in pips or price units. Say your EUR/USD stop is 50 pips away.
- Apply the position size formula: Position size = (Account size × risk%) ÷ stop-loss distance.
If one pip on a standard lot is worth $10, then 50 pips equals $500 of risk per lot. Divide your $100 risk budget by $500, and you land on 0.2 lots, a micro-to-mini-sized position that keeps your loss capped at exactly $100 if the stop gets hit.
A single oversized loss can be difficult to recover from on a leveraged or funded account, since drawdown limits are often fixed and unforgiving. That’s why many funded-account programs treat 1:2 as a mandatory floor rather than an aspiration.

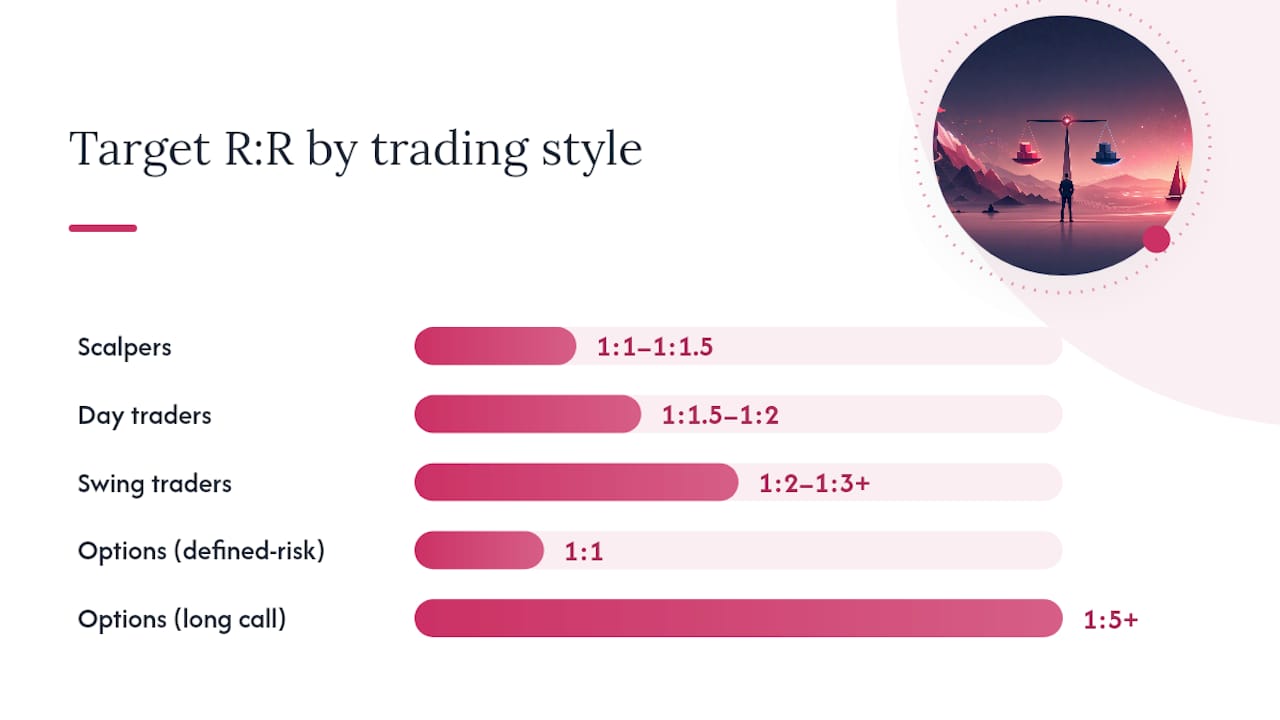
Realistic Risk Reward Targets by Trading Style
Not every trading style should chase the same ratio, and pretending otherwise sets people up to fail. A scalper holding trades for seconds or minutes physically cannot wait for a 1:3 move before the setup invalidates itself. A swing trader holding for days can afford to.
- Scalpers typically work with 1:1 to 1:1.5 ratios, compensating with high win rates and high trade frequency.
- Day traders usually target 1:1.5 to 1:2, balancing enough reward to cover spreads and commissions against realistic intraday price swings.
- Swing traders often aim for 1:2 to 1:3 or higher, since wider stops on multi-day timeframes need proportionally larger targets to justify the hold.
- Options traders see wildly varying ratios depending on the strategy. A defined-risk spread might target 1:1, while a long call speculating on a big move can post 1:5 or more, rarely hitting.
Volatility and cost structure push these numbers around. A highly volatile asset naturally needs a wider stop, which means your target has to stretch further to preserve the same ratio. Illiquid markets with wide spreads eat into reward before you even factor in commissions.
Pro Tip: Don’t pick a ratio first and then force a stop-loss to fit it. Set your stop based on market structure or an ATR multiple, then see what ratio the market actually offers you at that target. Backtest that number against your real win rate before trusting it with live capital.
Why Your Real Risk Reward Ratio Rarely Matches Your Plan
The ratio you calculate on a chart and the ratio you actually realize are two different numbers, and the gap between them is where a lot of trading plans quietly fail. Moving your stop further away because you don’t want to be wrong, or closing a winning trade early because you’re nervous it’ll reverse, destroys the expectancy math you built the trade on in the first place. A planned high ratio often collapses in practice precisely because traders adjust the boundaries after the trade is already live.
Costs eat into the ratio even when you do nothing wrong. Spreads, commissions, slippage on entry and exit, and overnight funding or swap rates all chip away at realized reward without touching the number on your original plan. A planned 1:2 setup can degrade to something closer to 1:1.7 once those frictions are factored in, particularly in fast-moving or lower-liquidity markets.
- Predefine both stop and target before entry, and treat them as fixed unless the trade’s original thesis is actually invalidated.
- Estimate spread and commission costs in your plan, not after the fact.
- Track your realized ratio against your planned ratio in a trading journal, and pay attention when the gap grows.
- Be cautious with partial exits. They lower risk, but they also mechanically lower your blended reward if not accounted for.
Pro Tip: Review your last 20 trades and compare the ratio you planned against the ratio you actually got. If the gap is consistently wide, the problem usually isn’t the market. It’s what you did after entering.
Applying Risk Reward Ratio on the Cubomarkets Platform
Locking in a risk reward ratio only works if your execution matches your plan, which is why the order ticket matters as much as the math behind it. On Cubomarkets, you set entry, stop-loss, and take-profit directly on the order ticket before a position opens, so the ratio you calculated is the ratio that actually goes live, not something you eyeball after the fact.
- Enter your stop and target as fixed price levels on the order ticket to lock your intended ratio at the moment of execution.
- Use the platform’s position-size tools to translate account percentage risk and stop distance into a precise lot or share size, removing manual pip-dollar math from the equation.
- Track realized outcomes after fills close, comparing planned ratio against actual, since spreads and any swap charges show up directly in your P&L history.
- Review your trading accounts setup to match account type and leverage to the risk percentage your plan calls for.
Traders who want to test this math without funding a live account can do so through a demo environment before committing real capital, which is the cleanest way to see how planned ratios hold up against real fills.
Ready to put this into practice? Open a trading account with Cubomarkets and use the platform’s order tools to set your entry, stop, and target in one step, with spreads starting at 0.0 pips so execution costs eat less into your planned ratio than they would elsewhere.
Key Takeaways
A favorable risk reward ratio lowers the win rate you need to be profitable, but only expectancy, which combines ratio and win rate together, tells you whether a strategy actually makes money.
| Point | Details |
|---|---|
| Know the formula | Risk equals entry minus stop; reward equals target minus entry; divide to get your ratio. |
| Use 1:2 as a starting floor | It requires only about one-third win rate to break even, a common baseline for funded accounts. |
| Calculate expectancy, not just ratio | Expectancy = (win rate × average win) − (loss rate × average loss) is the real profitability test. |
| Size positions before entering | Cap risk at 1% to 2% of account equity per trade to survive losing streaks. |
| Match ratio to strategy | Scalpers often work near 1:1, swing traders often push toward 1:3, and costs shrink both. |
What Actually Matters When You Use This Ratio
The conventional advice to “just aim for 1:2 or better” isn’t wrong, but it’s incomplete enough to be misleading on its own. A rigid 1:2 rule applied to every setup ignores that a scalper forcing a 1:2 target on a five-minute chart is often just widening a stop or moving a target until the math looks right, not actually finding a better trade.
What the math in this guide actually supports is a shift in priority: calculate expectancy before you fall in love with a ratio. A high win rate at 1:1 can outperform a low win rate at 1:3, and most retail traders never run that comparison before choosing a strategy. Overrated: chasing the highest possible ratio on every trade. Underrated: keeping a journal that tracks your realized ratio against your planned one, since that gap usually exposes exactly where discipline is breaking down.
If you take one thing from this article, make it this: set your stop and target before you enter, size the position to survive being wrong, and let the expectancy number, not the ratio alone, tell you whether the trade was worth taking.
— Cubo
This article is general information, not a substitute for advice from a qualified financial advisor. Consult a qualified financial professional about your own circumstances before acting on anything here.
Sources
The calculations and benchmarks in this guide draw on a handful of sources traders return to repeatedly. Investopedia covers general risk management and position sizing. BabyPips offers trader-focused guidance on realistic ratios and behavioral pitfalls like moving stops. Binance Academy lays out clean breakeven-math explanations. Velotrade breaks down how funded-account traders treat ratio as a survival metric rather than just a profitability target.
- What Is the Risk/Reward Ratio and How to Use It | Binance Academy on Binance Square
- Risk/Reward ratio — Investopedia
- Risk-Reward Ratio: Calculate, Apply & Trade Smarter | FundedFast