Skip to content
Depth of Market in MT5 is a real-time order book that shows you the bid and ask prices stacked around the current market price, along with the volume waiting at each level. On exchange-traded instruments it reflects actual orders from other market participants; on OTC symbols it often reflects broker-generated quotes instead, so the volumes you see aren’t always genuine liquidity. This guide covers how to open it, trade from it, read it correctly, and where its limits catch traders off guard.
TL;DR:
- Real exchange-based DOM displays actual orders, but OTC broker-generated data often reflect fake volumes that should not be trusted as liquidity signals.
- The depth shown depends on broker settings and contract symbols, with some instruments providing no real order book data at all.
- To avoid misreading, always verify if your broker streams genuine volume data and check your trade volume setting before placing orders from the DOM.
- Confirm order fills and actual prices using the History tab to prevent execution errors caused by volatile or fake depth levels.
- Practicing with DOM on a platform like Cubo Markets, which offers real-time, transparent execution, improves accuracy in reading order flow.
Table of Contents
- What Depth of Market Shows in MT5: Fundamentals and Exchange vs. OTC
- How Do You Open the DOM Window in MT5?
- Trading Directly From the DOM Window
- Reading DOM: What Counts as Real Liquidity
- Time and Sales and Tick Charts: Confirming What the Book Shows
- Where DOM Falls Short: Server Limits and No History
- Practical Checklist and a Pro Tip for Using DOM Well
- Our Take: DOM Rewards Discipline, Not Speed
- Try Depth of Market on a Cubo Markets MT5 Account
- Sources
What Depth of Market Shows in MT5: Fundamentals and Exchange vs. OTC
DOM, sometimes called Level II data, goes further than the simple bid/ask/last price you see on a chart. Instead of one number for the best bid and one for the best ask, it stacks multiple price levels on each side, with the volume resting at each one. That stack is what lets you see whether a price level has real weight behind it or almost nothing supporting it.
The catch is that not all DOM data means the same thing. Exchange-mode DOM reflects real orders and volumes placed by other market participants, the kind of data you’d get trading a listed future or a stock on its home exchange. OTC DOM, which covers most forex and CFD symbols offered by retail brokers, can be built from broker quotes rather than an actual order book. If your broker doesn’t stream real volume data, the DOM window falls back to functioning as a scalping ladder, showing price steps calculated from the current bid and ask rather than genuine resting size.
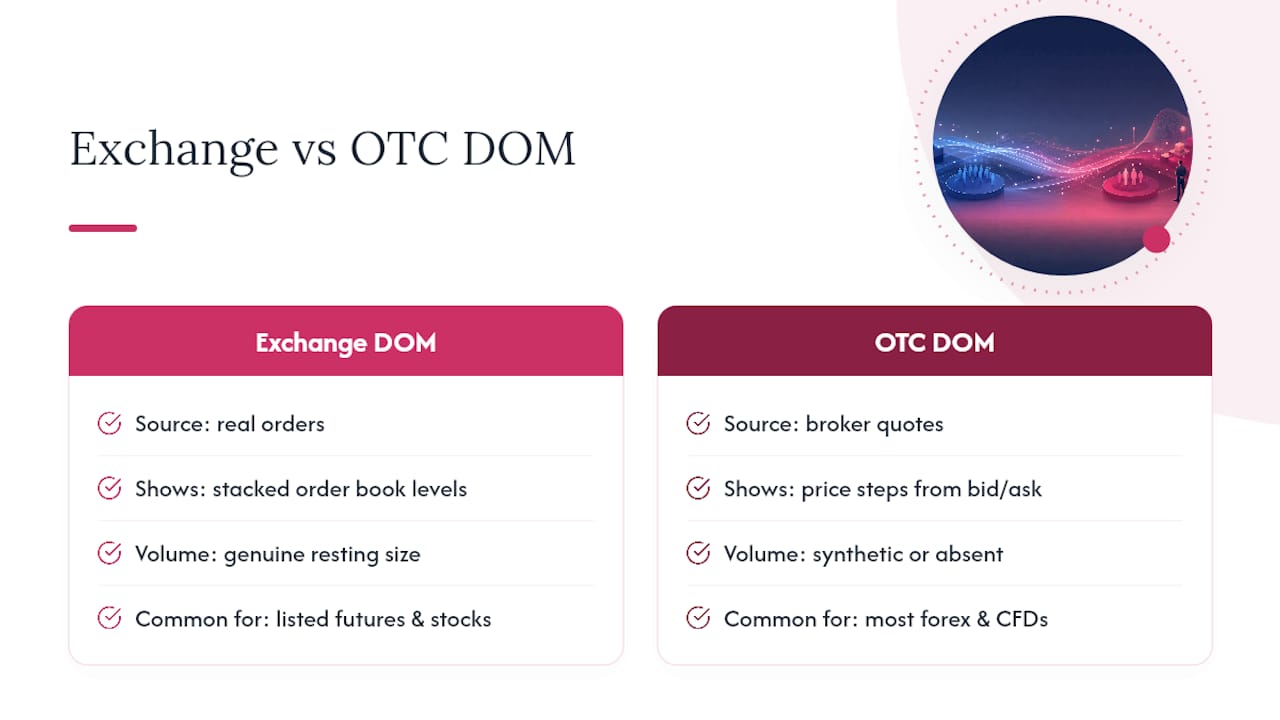
Behind the scenes, a server-side setting called SYMBOL_TICKS_BOOKDEPTH caps how many price levels MT5 will display for a given symbol. The actual depth transmitted varies by symbol, and some symbols may not have any order book data sent, showing just a quote feed instead.
This matters practically because a thin or fake-looking book doesn’t automatically mean the market is illiquid. It might just mean your broker isn’t broadcasting real depth for that instrument, and you should treat the volume figures as decoration rather than signal.
How Do You Open the DOM Window in MT5?
Getting to DOM takes seconds once you know the path, and it works slightly differently depending on whether you’re on a desktop terminal or a phone.
On desktop, here’s the routine:
- Open Market Watch (Ctrl+M if it’s hidden).
- Right-click the symbol you want to inspect.
- Select Depth of Market from the context menu, or press F2 with the symbol highlighted.
- The DOM window opens as a floating panel you can dock, resize, or bind to an open chart.
Binding DOM to a chart is worth doing early. Once linked, clicking a price level in the DOM can sync your chart’s crosshair to that price, which speeds up cross-referencing volume clusters against support and resistance you’ve already drawn.
On mobile, the path is nearly identical across platforms. Open the Quotes tab, tap the symbol you want, then select Depth of Market from the symbol menu. Android and iPhone versions of the MT5 app both surface this option, though the exact icon placement shifts slightly between versions.
Once open, the DOM interface breaks into three visual columns: Volume, Price, and a Trading column of clickable buttons. Bid levels typically appear in one color below the current price, ask levels in another color above it, and the spread sits visibly in between. A toolbar along the top or side toggles extra views, including Time & Sales, a tick chart, and an “advanced mode” that adds order management controls directly into the ladder.
Before you place anything, set your trade volume in the field at the top of the window. It’s easy to skip this step and fire an order at the wrong lot size, so check it every time you open a fresh DOM session, especially after switching symbols. Many terminals also let you toggle between lots and raw units for the volume display. Set that preference once and leave it, since flipping it mid-session is a common source of sizing mistakes.
Trading Directly From the DOM Window
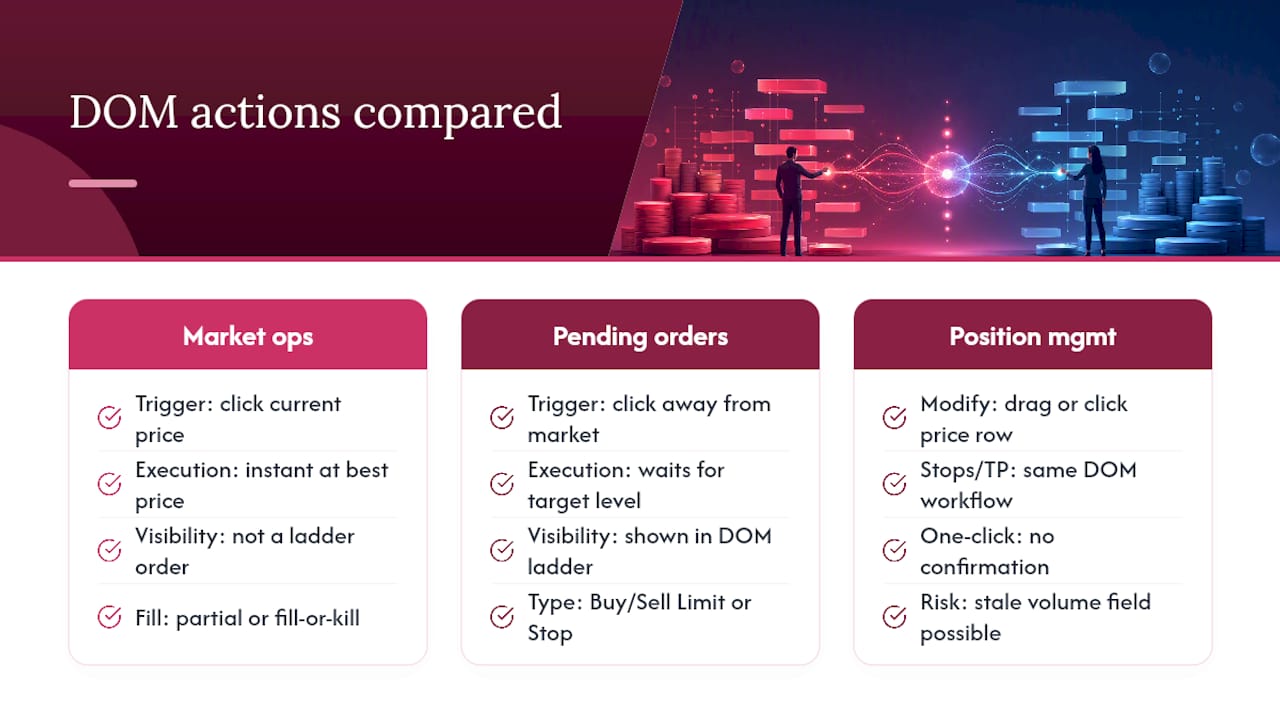
DOM in MT5 supports two distinct kinds of operations, and knowing which one you’re triggering matters more than it sounds. Market operations execute instantly at the best available price, while trade requests place pending orders that wait for the market to reach a specified level.
For an instant buy or sell, you click the Buy or Sell button in the Trading column at the current best price. These fill immediately, subject to whatever volume is actually available at that price. If your requested size is larger than what’s resting there, some brokers fill it in pieces at successively worse prices, while others apply fill-or-kill logic and reject the order outright rather than partial-fill it. Check your broker’s execution policy so you’re not surprised by either behavior during a fast market.
Pending orders work by clicking a price level away from the current market. Click below the current bid and MT5 typically defaults to Buy Limit or Sell Stop, depending on direction; click above the ask and you get Sell Limit or Buy Stop. The DOM ladder then displays that pending order right in the price stack, so you can see it sitting alongside real market volume, which is a genuinely useful visual check that a static order ticket doesn’t give you.
Managing an open position’s Stop Loss and Take Profit works the same way; drag the level or click the corresponding price row to modify or delete it. Nothing here is forgiving of a mis-click, which is why one-click trading deserves respect rather than convenience. When it’s enabled, a single click on a price level sends a live order with no confirmation dialog. Combine that with a volume field left at the wrong size from a previous symbol, and you can send a position many times larger than intended in under a second.
After any DOM-triggered order, check the History tab to confirm what actually filled, at what price, and for what volume. Don’t assume the ladder’s last displayed price is what you got, particularly during volatile stretches when the book can move between your click and the server’s response.
Reading DOM: What Counts as Real Liquidity
Raw numbers in a DOM window only become useful once you know what to look for. A healthy order book generally shows multiple price levels carrying meaningful volume, which tends to correlate with tighter spreads and cleaner fills. A thin book, by contrast, with one or two levels holding size and nothing behind them, is a warning that your next market order could slip further than expected.
Clustered volume at a specific price is worth watching closely. A large resting order, sometimes called a wall, can act as informal support or resistance, at least until it gets consumed. Watch what happens when price actually reaches that level: if the wall holds and price bounces, other participants are respecting it; if it disappears rapidly without much price movement, it may have been pulled rather than filled, a common pattern when a market maker is testing depth rather than committing to it.
Imbalances between the bid and ask sides carry information too. A book stacked heavily on the buy side relative to the sell side suggests short-term buying pressure, though this reading works best on genuine exchange DOM rather than an OTC feed built from broker quotes. That’s the caution worth repeating here: before trusting any volume figure as a signal, confirm whether your broker actually streams real order-book data or just a synthetic price ladder. Trading a fake wall as though it were real institutional size is one of the more common DOM misreads among newer users.
A practical scenario: you see depth thinning noticeably on both sides just ahead of a scheduled economic release. That’s usually a signal that market makers are pulling size ahead of expected volatility, not that liquidity has vanished for good. The sensible response is to widen your expectations for slippage or simply step aside until the book rebuilds after the news hits.
Time and Sales and Tick Charts: Confirming What the Book Shows
The DOM window’s toolbar usually includes a Time & Sales tape alongside the price ladder, and it deserves as much attention as the book itself. Time & Sales logs every executed trade with its timestamp, direction, price, and volume, using color coding to mark buy versus sell aggression. Where DOM shows you resting orders, Time & Sales shows you what actually traded, which is the difference between intention and action.
The companion tick chart plots each of those executions as a point in time, letting you see whether trades are clustering at a specific price or spreading out. Watch for a burst of same-direction prints hitting the tape right as a DOM wall gets consumed. That combination, heavy aggressive volume paired with a disappearing price level, is a stronger signal than either piece of data alone. On genuine exchange instruments, this pattern of clustered aggressive trades clearing visible depth often precedes a fast directional move, which is exactly why floor traders have leaned on tape reading for decades before DOM software existed.
Before sizing into a larger trade off a DOM reading, glance at Time & Sales first. If the tape isn’t confirming real execution pressure, the book pattern you’re watching may just be noise.
Where DOM Falls Short: Server Limits and No History
Two technical realities are worth knowing before you build any strategy around DOM. First, the SYMBOL_TICKS_BOOKDEPTH property that sets your maximum visible price levels is defined by the broker’s server, and the actual book transmitted can be smaller than that maximum, with some symbols reporting zero depth entirely. Developers can query this property directly through MQL5’s SymbolInfoInteger() function to check depth support before building an execution tool around a given symbol.
Second, and more consequential for most traders: DOM is broadcast live only. Neither the terminal nor typical broker servers archive order-book history, so there’s no way to scroll back and review yesterday’s book the way you’d review a price chart. That rules out any backtesting of DOM-based strategies using standard historical data.
The workaround, for traders serious about studying order-flow patterns, is recording it yourself. MQL5 exposes MarketBookAdd(), MarketBookGet(), and an OnBookEvent() handler specifically for subscribing to live DOM changes and logging them programmatically. A few completed tools on the MQL5 Market already do this if you’d rather not build one from scratch. Either way, filter for symbols with confirmed non-zero book depth first, since recording a synthetic OTC ladder won’t teach you anything about real order flow.
Practical Checklist and a Pro Tip for Using DOM Well
A short routine keeps most DOM mistakes off your account statement:
- Confirm whether your broker streams real volume or a synthetic price-step ladder before trusting any depth reading.
- Set your trade volume field every time you open DOM on a new symbol, especially with one-click trading enabled.
- Check the History tab after every DOM-triggered order to confirm actual fill price and volume.
- Treat a single DOM snapshot with suspicion; a wall that vanishes in seconds was likely never real size to begin with.
Pro Tip: Don’t chase every cluster you see. Pair DOM observation with Time & Sales before acting, and if you’re new to reading order flow, record a few sample sessions on a demo account first so you can review what a genuine liquidity shift actually looked like versus a broker-side quote adjustment.
Our Take: DOM Rewards Discipline, Not Speed
The common pitch around Depth of Market treats it as a scalper’s secret weapon, something that only matters if you’re firing orders in fractions of a second. That framing undersells what DOM is actually good for. Its real value is giving any trader, on any timeframe, a window into supply and demand that a candlestick chart simply doesn’t show. You don’t need millisecond reflexes to benefit from seeing a wall build or dissolve before a breakout.
Where conventional advice falls short is in treating all DOM data as equally trustworthy. It isn’t. A depth reading on an OTC forex pair and a depth reading on an exchange-listed future carry very different levels of confidence, and most retail material glosses over that distinction entirely. If you take one thing from this guide, verify your broker’s volume data before you build any decision process around it.
Start small. Watch DOM alongside Time & Sales for a week without trading off it. Notice which patterns repeat and which turn out to be noise. That habit will do more for your execution than any indicator you could bolt onto the chart.
— Cubo
Try Depth of Market on a Cubo Markets MT5 Account
Reading DOM well takes practice, and practice needs a platform where execution actually matches what the book showed you. Cubomarkets runs on MetaTrader 5, offering trading with competitive spreads and commission structures, so the price ladder you’re watching reflects real trading costs rather than a spread that widens the moment you click.
That combination matters more than it sounds when you’re testing DOM-based entries: slippage and execution delay can make a good read look like a bad trade, and fast, transparent fills remove that variable from the equation. Whether you’re working forex pairs, commodities, or crypto CFDs, the same DOM tools and Time & Sales tape covered above are available the moment you open a chart.
If you want to see how your own DOM reading holds up in live conditions, open a trading account with Cubomarkets and start on a demo before committing real size.
This article is general information, not a substitute for advice from a qualified financial advisor. Consult a qualified financial professional about your own circumstances before acting on anything here.
Sources
- Depth of Market – Trading Operations – MetaTrader 5 Help
- Depth of Market – Trading automation – MQL5 Programming for Traders